Click slide for next, or goto previous, first, last slides or back to thumbnail layout.
Click slide for next, or goto previous, or back to thumbnail layout.
Click slide for next, or goto previous, first, last slides or back to thumbnail layout.
Click slide for next, or goto previous, or back to thumbnail layout.
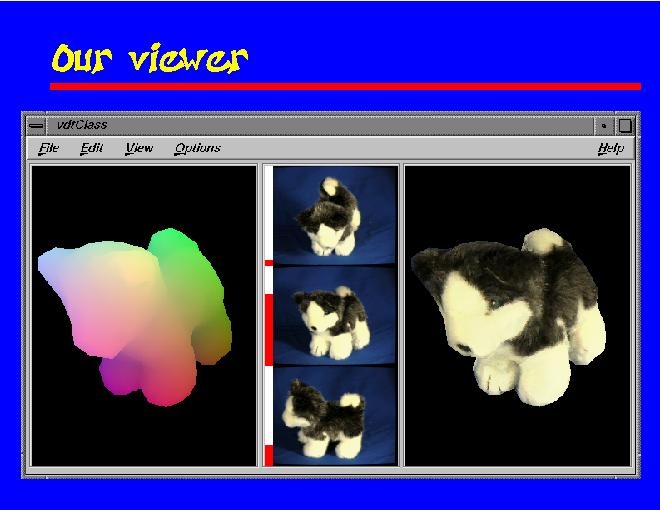
This slide illustrates our interactive viewer. In the left there is a false color rendering of the object geometry. The red component of each pixel encodes the x coordinate of the surface point visible through the pixel, similarly the green and blue components encode the y and z coordinates.
In the middle are shown the three input images chosen for the current view. The directional weight is indicated as the red bar on the left. The quality and feathering weights have been precomputed and stored with each pixel of the input images.
The final rendering is shown on the right.