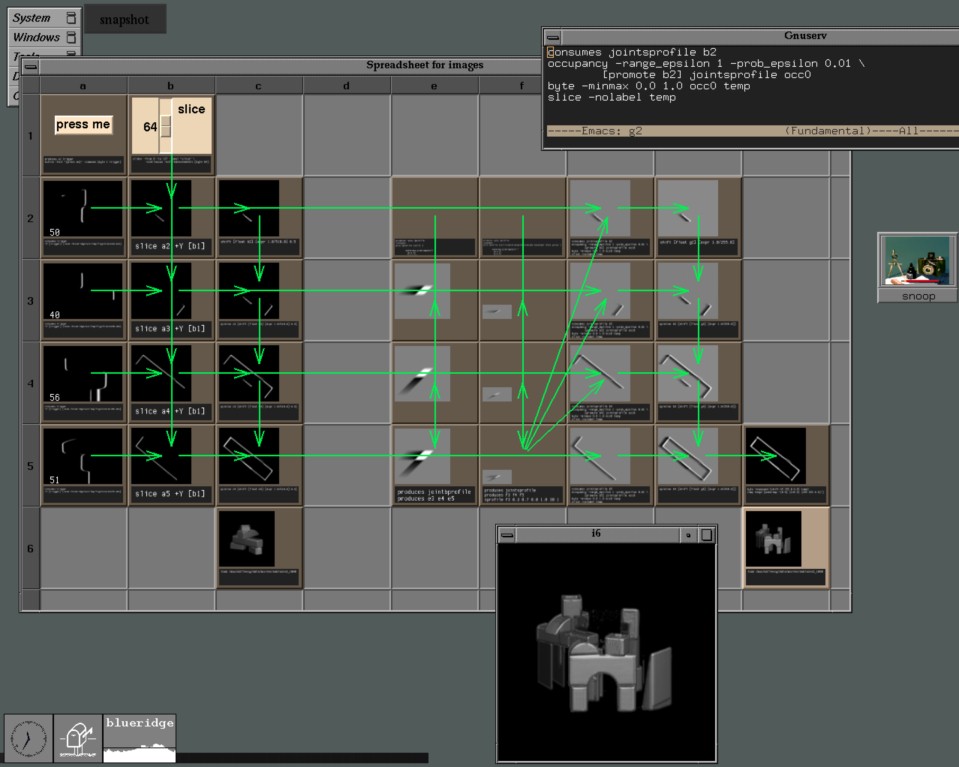
The majority of commercially available image processing and data visualization systems employ a dataflow paradigm. Users select modules from a menu and wire them together using an interactive flow chart editor. We are investigating an alternative paradigm based on spreadsheets. Cells in such a spreadsheet contain graphical objects such as images, volumes, movies. Cells may also contain graphical widgets such as buttons, sliders, or movie viewers. Objects are displayed in miniature inside each cell. Formulas for cells are written in a programming language that includes operators for array manipulation, image processing, and rendering.
This project is currently inactive. However, if a Stanford student is looking for a challenging software project, I'd like to productize this package for distribution to the visualization community. There are also several interesting extensions one could make to the package, possibly requiring fresh research. One extension would be to add geometric models, for example dense polygon meshes, as a fundamental datatype. Another extension would be to reimplement the image processing (and other) operators using image pyramids so that processing cost is proportional to the size of the rendered image in each spreadsheet cell. When the cells are small, computations are fast. If the user stretches the spreadsheet, the cells get bigger and computations slow down. If the user clicks on a cell, that cell is recalculated at full resolution.
A list of technical papers, with abstracts and pointers to additional information, is also available. Or you can return to the research projects page or our home page.